Initial Research Study Preview: Uniform Law Adoption Analytics
There are many facets of the law to which data science and computational legal science methods can be applies and many aspects of such science that can be applied to any given facet of the law. One of the promising entry points being pursued by the Legal Science research team here at the MIT Media Lab is with an important body of statutes known as "Uniform Law". The idea was initially proposed by the kick-off LegalScienceSalon Keynote Speaker Joshua Lenon, of Clio and has proven to be an excellent match. This body of law has some great characteristics making it especially amendable to analytics, including that the 50 state legislatures that enact these statutes all receive the initial legislative bill language from a single point source: The National Conference of Commissioners on Uniform State Law (NCCUSL). Legal Science research lead Dazza Greenwood brings significant experience with this method of law making engagement with drafting the Uniform Electronic Transactions Act (UETA), among other uniform laws. This direct experience, combined with the fresh perspectives and insights available when the body of law is analyzed as data, make this type of legal instrument especially well suited for exploration and analytics by the Legal Science research team.
Preliminary Analytics and Visualizations:
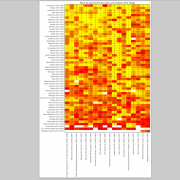
MIT Human Dynamics Lab data science visiting graduate student Luc Rocher (with oversight and feedback by Human Dynamics doctoral student Yves-Alexandre de Montjoye) generated the visualization below (available in higher resolution here), depicting the normalized time it took each state to adopt a sample set of uniform laws. The colors are based upon the average time for adoption by states. The median time overall is show next to the name of the law. The states are ranked according to their borda count and dT is the average time it took them to enact.
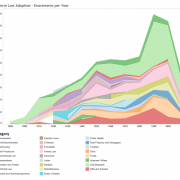
MIT Human Dynamics Lab legal research team collaborator Ray Campbell generated the visualization below using the Tableau visual analytics package and hosted service. A higher resolution image in available here and an interactive version is available here.